Bearish Easter Cream & Fat Facts

The first two trading days of this week have been relatively quiet. Butter, cheese, SMP — pick your commodity, and you'll find the same story: a market stuck between weak fundamentals and a lingering fear of what surprises are hidden in the future. The data points down. The fear of being caught short points up. And somewhere in between, the market is doing its best impression of a man standing at a crossroads, arms folded, refusing to move.
Short term, most of our trading partners are aligned: the path of least resistance is lower. And honestly, that feels logical when you look at the numbers. But we've all watched butter, cheese — even SMP — move a few hundred euros in a week when the herd decides to panic in the other direction. Following the crowd on the way down feels safe, right up until the moment it isn't.
So the official GFD market view for the next few weeks is: down, until we go up. Feel free to quote us on that.
With Easter in front of us and wild speculation filling every WhatsApp group we are in, we decided to do something more useful than speculating. We looked at the data. Specifically, we went back through the cream and fat numbers around the Easter window — and what we found doesn't exactly support the bulls.
Cream: what the data tells us
Every year around Easter, the same story plays out across Europe. Cows transition to spring grass, milk volumes climb sharply, and cream — the most immediate outlet for surplus butterfat — absorbs the first wave of that flush before it ever reaches the butter churn. The result is a predictable window of pressure, typically running for two weeks on either side of the long weekend.
We looked at twelve years of data from 2014 onwards. The conclusion is hard to argue with. In every single bear market year in that dataset, cream was lower two weeks after Easter than it was at Easter itself — no exceptions. Not once. The drops range from a mild −2.2% in 2019 to a brutal −15.1% in 2023, with an average across all bear years of −7.6%. The only years that bucked the seasonal pattern were 2017 and 2018 — both strong bull markets with structurally tight fat supply and aggressive forward buying. That is not the market we are in today. Not even close.
After one month the picture becomes noisier. The data averages −2.8% across bear years, but the range is wide and the outcome depends heavily on how fast the spring flush builds and whether any buy-side demand re-emerges after the holiday. In deep bear markets like 2015 and 2023, the weakness extended well into May. In years where the market found a short-term floor — 2014, 2021 — a partial recovery was visible within four weeks. The one-month window tells you less about Easter and more about the underlying trend. And in 2026, that trend is, in our view, clearly down.

Three scenarios for the next four weeks
With cream last quoted at €3,820 heading into Easter, history gives us a narrow range of realistic outcomes — and none of them are bullish in the short term.
A deep bear correction, mirroring 2015 or 2023, would put cream around €3,440 at two weeks and €3,550 at one month. An average bear move — more in line with 2021 or 2025 — lands around €3,610 and €3,710. Even the most optimistic scenario, a flat or mild correction analogous to 2014 or 2019, sees cream near €3,740 at two weeks with only a marginal recovery to €3,860 by one month. There is no scenario in this dataset — outside of a genuine bull market — where cream rises in the two weeks following Easter. We see no bull market.
Butter: when cream leads, butter follows
Cream and butter are not two separate markets. They are the same market, measured at different points in the production chain. Cream is the raw material; butter is what you get after you churn it. When cream falls hard, butter follows — the only question is how much, and how fast.
The historical pattern is consistent. Over all six Easter windows where we had weekly butter data available, butter declined in the two weeks after Easter in every single year — 100% of cases. The drops are more modest than cream in percentage terms: an average of −1.8% at two weeks versus a higher percentage for cream over the same window. This makes sense. Butter is one processing step removed from the flush. Cream absorbs the first wave. Butter feels it shortly after.
Looking at the ratio between the two tells an even cleaner story. In every year from 2020 to 2025, butter traded between 0.83x and 0.89x the cream price at Easter — consistently below cream. That relationship has held across bull markets, bear markets, and Covid distortions alike. The average is 0.87x.
Which brings us to the number that matters most in 2026. As of March 24, cream is at €3,820 and butter is at €4,090. Butter is trading above cream. That puts the current ratio at 1.07x — inverted, and a situation that has not occurred at a single Easter reference point in this dataset. What happened is that cream collapsed from €5,310 on March 10 to €3,820 by March 24 — a drop of nearly 28% in two weeks — while butter has not yet caught up. The market is out of balance.
That gap will close. It always does. Processors facing cream at €3,820 have no economic justification to pay €4,090 for finished butter. As post-Easter cream availability increases and input costs remain soft, the case for current butter prices becomes harder to defend with every passing week.

Three scenarios for butter in April and May
The scenarios below are anchored on where butter needs to go to restore the historical 0.87x ratio — with cream moving as described in the cream section above. The seasonal post-Easter drop is a secondary factor; ratio reversion is the dominant force.
In a deep bear scenario, with cream falling to around €3,440, butter at the normal ratio implies approximately €2,990 — a decline of nearly 27% from current levels. In the average bear case, cream near €3,610 implies butter around €3,140, down roughly 23%. Even in the most benign scenario, where cream barely moves from here, butter at 0.87x of €3,740 still implies approximately €3,250 — a decline of over 20% from today.
The message from every scenario is the same. There is no path from current cream prices to current butter prices that makes fundamental sense. The inversion is temporary. The correction is a question of when, not whether.
The bear case — and why this time might be different (but probably isn't)
History is a mirror, not a crystal ball. And right now, that mirror is showing something uncomfortable for anyone sitting on the sidelines waiting for an Easter bounce.
We are the first to acknowledge that trends are made to be broken. The current cream-butter ratio is proof of that — at 1.07x, with butter trading above cream, we are already in territory that has never appeared in six years of Easter data. If a relationship that held with near-perfect consistency across bull markets, bear markets, and a global pandemic can invert in the space of two weeks, then clearly nothing is guaranteed.
The world does not feel normal right now. War, geopolitical tension, and a renewed fear of inflation are real forces that can distort commodity markets in ways that historical datasets simply cannot capture. We are aware of that. A supply shock, a sudden policy shift, or a sharp reversal in the macro environment could rewrite the script quickly — and we have seen it happen before.
But here is the thing about historical patterns in commodity markets: they are rarely broken by wishful thinking. They are broken by fundamental change. And right now, the fundamentals are not changing in butter's favour. Milk is flowing at record levels. EU stocks are building towards an all-time high forecast of 355 kt by July. The structural pressure that has been building since late 2025 has not gone anywhere.
Our bear case scenario for butter — prices gravitating towards the €3,000 level — may look extreme at first glance. But it is not a number we invented this week. In October last year, when we modelled the consequences of sustained high milk volumes not slowing down, that was precisely where the analysis pointed. We are not moving the goalposts. The goalposts were always there. The market is simply still working its way towards them.
A word on what we are seeing internationally right now. The GDT Pulse — the bi-weekly early indicator for Global Dairy Trade — came in negative again this week. CME butter has traded lower again in the sessions since the long weekend. These are not isolated data points. They are part of a consistent pattern of bearish signal across every major international reference market. Cheese markets and the market for WMP also feel heavy, adding pressure to the fat section of every dairy commodity. When the trend is down in New Zealand, down in the United States, and building pressure in Europe simultaneously, that is the direction.
What concerns us most is not the sellers who are already in the market. It is the sellers who are not yet. The postponed sellers — those waiting for a post-Easter bounce that the data suggests will not arrive — are building a queue. And when that queue starts to move, it does not trickle. It accelerates. Sellers waiting for €4,200 become sellers at €4,000. Sellers at €4,000 become sellers at €3,800. The market does not reward patience when the underlying direction is down. It rewards those who face reality early.
This section is not trading advice. It is not a recommendation to sell, to buy, or to do anything at all. It is a mirror into a good few years of market behaviour for those who believe Easter changes something. The data says it does — just not in the direction some people are hoping for.
Facing reality is rarely comfortable. But facing pressured selling when you still have options is considerably less costly than facing it when you don't.
More from the desk
Our Long View Before Our Long Break 
Our Long View Before Our Long Break
Last week the market found a bit of stability. After lower trades on cheese, the cheese market traded slowly up, although a real rally remains absent. Butter prices did dip a bit further, although at the start of this week we see some strength on the back end of the curve. And on powder, our bullish feeling just doesn't go away — and now we can find some confirmation in the market as well.
Dairy Carry Has a Shelf Life 
Dairy Carry Has a Shelf Life
Last week was bearish across the board — every product we broker leaned the wrong way. Powders lost more momentum, cheese slipped well below €3,000 for some products, and butter continues to impress with just how much keeps showing up. Supply, supply, supply.
Summer Shopping or Summer Sale? 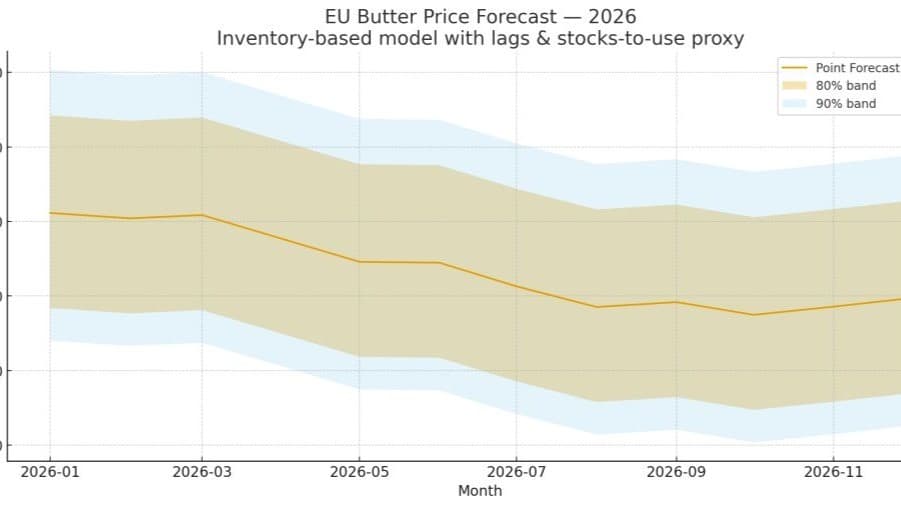
Summer Shopping or Summer Sale?
Last week was again a bit of a bearish week for the entire dairy industry. With cream prices under pressure and milk intake still strong, we keep seeing a market that has more supply than demand. Butter prices took another step lower, cheese prices cracked, and the powder market gave back a bit of its gains again.
The weekly report
Get it before it is anywhere else
Every market report, straight to your inbox the moment it is written. Butter, cheese, powder, liquids — pick what you actually trade.
Roughly weekly · Free · Unsubscribe any time