Ai Ai Ai, Why So Bearish?

After yet another hectic week, we expect things to calm down a bit in the days ahead. With most of our partners heading to Anuga in Cologne, trading activity in butter, skimmed, and cheese will likely be replaced by a different kind of trade — business cards, handshakes, and the occasional drink at the end of the day.
Between catching up with old contacts, chasing new business, and enjoying some friendly conversations, we assume the big topic once again will be the market — and where it’s heading. Last year, the halls of SIAL in Paris buzzed with a bullish tone, but that optimism faded quickly afterward. For some, SIAL marked the end of a long rally.
Now, many wonder if this year’s Anuga will bring a similar turning point. Will the market conclude that prices don’t need to drop any further? Or will Anuga act as a catalyst, nudging prices even lower? Unfortunately, we can’t attend this time, but we did take a good look at the data — with a little help from our digital friend, ChatGPT. And honestly, when we fed the last 20 years of data into AI and asked for a forecast, even we had to ask ourselves: “Ai Ai Ai, Why so bearish?”
Reports with a view
Our reports are known for having a view — an opinion, a direction. Sometimes that view resonates with buyers, sometimes with sellers, sometimes with traders, and occasionally with everyone… or no one at all. We base our reports on as much hard data as possible, but as everyone in dairy knows, hard data moves slowly. So we rely heavily on what we hear — insights gathered from our partners, our trades, and day-to-day market talk. Forecasting this market isn’t easy. After all, we’re dealing with living animals that can get sick, weather that can be too dry, too wet, too warm, too cold — or, on a good day, perfect. Prices are tied to feed, energy, and fertilizer costs, and of course, to global dairy demand. Anyone claiming to know exactly where this market is heading is lying. But saying it can’t be forecasted at all would also be untrue.
How we build our view
In today’s report, we want to show you how we arrive at our market view. We don’t just look at how many buyers or sellers there are, or how much milk is available — we try to take a wider perspective. Trying to get inside the head of a farmer, a dairy purchaser or a coop or a trader isn't easy, but we think anticipating important stakeholder behaviour is key to foreseeing where this market is heading to.
This report may not be a quick read, but we hope it gives you a good sense of how we think and how we base our outlook. Using data from Clal, StoneX Plus, Vesper, ZMB, EEX, and GDT, we’ve come to a conclusion that might not be popular among suppliers: this bearish market trend is far from over.
Risk Mitigation vs. Risk Taking
At its core, trading economics is simple: price is determined by the balance between supply and demand. In dairy, we see this most clearly in the liquid spot market.
Last year’s bluetongue disease caused a sharp drop in milk collections — supply fell, demand stayed the same, and prices for cream and raw milk soared, even surpassing farmers’ payout prices. But the opposite is just as true. A factory shutdown or maintenance period can suddenly reduce demand while supply stays stable, pushing raw milk prices down — as we saw again in the last weeks, dipping below 30 cents.
However, the balance between supply and demand is often confused with the balance between buyers and sellers. In last week’s cheese and butter markets, we could almost see two separate markets:
- Q4: sellers outnumber buyers, pushing prices lower.
- Q1: buyers outnumber sellers, leading to price stability (or even small increases).
Some take the market for Q1 (and further in 2026) as a sign that supply and demand are moving back toward balance. We disagree. We believe the Q1 market is driven not by fundamentals, but by sentiment — more players trying to mitigate risk in case prices rise again, rather than traders taking risk by betting on further declines. Understanding that difference — between supply vs. demand and risk mitigation vs. risk taking — is key to making a forward forecast.
Lessons from Q4
In June and July, Q4 prices held firm at high levels. But as we now know, that strength didn’t reflect supply and demand — it reflected fear. Buyers remembered last year’s price surge and didn’t want to be caught short again. Meanwhile, only a handful of sellers were willing to take the risk of selling slightly below the spot price. Producers were staying far from betting on lower commodity markets, and even most traders did not want to anticipate a drastic drop in prices.
Even when the data already pointed to much lower prices ahead, buyers kept buying, and sellers held back. The result was a temporary premium in the market, detached from reality. But such sentiment-driven premiums never last long. Now that Q4 has arrived, prices have adjusted to their true level — the one defined by actual supply and demand.
And what about Q1 and Q2?
Simply put: current prices for Q1 and Q2 don’t say much about real market value. What they do reflect is the balance between risk-takers and those trying to minimize exposure.
Stocks v.s Price
So, what’s the best way to predict forward prices? In our view, the best forecast for the future often lies in the past. Sure, we all know past performance is no guarantee for future results — but historical patterns are stubborn things. Trying to find the perfect formula to link stock levels directly to market prices might be oversimplifying it a bit, but it’s still the clearest mirror of supply and demand in action.
We asked our AI friends at ChatGPT to take a look at 15 years of butter data. We gave it StoneX stock data and official quotation prices from the same period and asked it to plot the two together. The result is the graph below.

Looking at the chart, a clear pattern appears. By the end of Q2 2012, stocks rose to just under 300,000 mt, and prices slipped below €3,000. The following year, stocks normalized, and prices bounced back. Then came summer 2016 — roughly the same stock level, roughly the same price drop. The next big stock peaks came in 2019, when prices fell toward €3,500.
The years 2020 and 2021 were strange ones — COVID distorted nearly every market rule. Low stocks led to lower prices, and high stocks coincided with rising prices. After the 2022 highs, the stock buildup in 2023 once again pulled prices down by the summer. The past 15 years show it clearly: the lower the stock, the higher the butter price. And as inventories build again, prices are softening once more. By the end of this year, stocks are forecasted to return to “normal” levels — justifying today’s price range between €5,000 and €5,500. But if the summer of 2026 truly brings record-high stock levels (320.000mt stock+), it’s hard to see why prices wouldn’t correct again, just as they’ve done every single time before.
Of course, we can debate how accurate this forecast model is. But we trusted the StoneX model during the last bull run, and it didn’t disappoint. In fact, we’d argue that today’s forecast is rather conservative — it likely underestimates the import volumes we expect and downplays the strong production data coming from several EU countries and major processors.
When we asked ChatGPT to produce a forecast with a confidence range, the result was — let’s just say — impressively bearish. Even for our standards. We suspect the model doesn’t factor in inflation or long-term growth in consumption strongly enough. And to those who argue exports might cushion price declines — we’d say that’s probably offset by the conservative import assumptions in the same model.

If you’re curious about the formula used for the price forecast, just reach out — we’re happy to share it (and maybe complain about the AI’s gloomy mood while we’re at it).
Cheese: More Difficult
Doing the same exercise for cheese is a tougher challenge. Butter prices — whether lactic or sweet, French or German, fresh or frozen — generally move within a relatively tight band. Cheese, however, is trickier. Reliable data, especially consistent price data, is harder to come by. We used EEX Gouda as our benchmark, as it’s the product we broker most often. The dataset only goes back to 2021, but older Clal and Kempten data show that from 2016 to 2021, Gouda typically traded just below or just above €3,000. That the EU has built a lot more cheese production capacity is starting to be clearly visable in the chart below. That additional capacity has been built to keep up with growing demand. But according to the picture below, that increase in capacity might have come online a bit faster than the demand curve grew.

What we see is that cheese prices react to stock levels in a similar way as butter. In 2022, when stocks were low, we remember brokering Gouda well above €5,000. Once inventories normalised, prices fell below €3,000. Last year’s cheese rally, driven by butter’s strength, never felt sustainable — and the stock data explains why. With record-high cheese inventories today, prices are heading back toward historic lows.
Extra production capacity across Europe is running full tilt, imports are up, and exports are down. Domestic demand is steady, but oversupply is causing headaches. Looking at the stock forecast, dark clouds are forming over the cheese market. More Exports are needed fast — otherwise, Europe will have to build more storage capacity for cheese instead of production capacity.
When we asked ChatGPT to generate a price forecast, the result was so low we asked it to redo the math — several times. Still, based on current stock projections, we think it’s fair to say prices could not drop as low as AI suggest (below € 2000,-). But a heavy correction is In line with our own analysis, if cheese stocks climb above this year’s peak stock levels, next year’s prices could easily test the €3,000 support line — and likely dip below it in the first months of the year, when seasonal demand is at its weakest. The first reports from traders have already come in about cheese purchases just below € 3000,-.
Powders: Worldwide Impact
Finally, let’s complete the stock–price picture with Skimmed Milk Powder (SMP). Like with butter and cheese, we see a pattern where prices rise when stocks fall, and fall when stocks grow. But here, the correlation is much weaker. SMP is more globally exposed — it doesn’t live in a purely European bubble. Over the past two years, EU stocks have been relatively tight, yet prices barely moved. That’s because the SMP market is far more influenced by global dynamics than regional stock levels. Another complicating factor is the long shadow of intervention stocks. For several years, those massive inventories distorted the data so heavily that finding a clean formula linking EU stocks to price trends is almost impossible.

If we zoom out and look at the key suppliers — the EU, New Zealand, and the U.S. — we see healthy milk and powder output across the board. With international trade running at a steady pace, the missing piece is a bullish China to lift demand. Without that, the current supply is likely to outpace demand, and the slightly higher EU stock forecasts could easily translate into softer prices — especially if exchange rates don’t swing in favor of EU exports. Asking ChatGPT to make a forecast based on unchanged export conditions it forecast a flat line throughout 2026 between € 1950 and € 2250,- something we would get behind on.
Milk Price Impact
Much of the forecast data we use is based on one key assumption: milk collections follow milk prices. Strong farm-gate prices always stimulate higher milk output, while lower prices eventually reduce production. The tricky part is timing — production changes far more slowly than the market expects.
We’ve made that same mistake ourselves this year. Back in February, when farm-gate prices were already strong, we expected higher milk volumes to flow quickly through the system — a kind of “pre-flush flush.” But milk doesn’t move that fast.
Production reacts to farm-gate prices with a delay, and there are several reasons for that:
- Biological lag: Farmers can’t just flip a switch. Cows already in milk continue producing for months.
- Investment inertia: Decisions about feed, breeding, or culling are based on future expectations, not last week’s price.
- Contracts and policy: In many EU countries, farmers work under semi-fixed delivery or price arrangements, softening the effect of short-term market swings.
As a result, milk production often keeps rising for 3–6 months after prices start to fall — before stabilizing or declining.

From a statistical point of view, the correlation coefficient between EU milk production and farm-gate prices is roughly 0.54 — a moderate positive relationship. In simple terms: when production rises, prices tend to rise too, but not perfectly. Weather, exports, and feed costs all add plenty of noise.
The average lag we find is about five months — meaning it typically takes five months before farm-gate prices reflect a change in milk production. Likewise, it takes roughly the same time for milk production to react once prices start falling below the incentive price for farmers to produce more. By that assumption, we would expect the milk price to drop below farmers' interest earliest by the end of Q1, impacting supply by the end of Q3.
In other words:
The dairy market moves slowly — like milk through a cold pipeline. What you see today in production is the echo of milk prices from five months ago.
The Road Ahead: Navigating a Cautious Market
Looking at last week's price stabilisation for Q1 and Q2, it’s tempting to hope the worst is behind us — but hope has never been a strategy. The combination of high stocks, stable milk intakes, and sluggish demand still points to more downside risk than upside potential.
That doesn’t mean the market will collapse further overnight. Prices have already corrected sharply, and we expect short-term stabilisation in some products — especially where risk mitigation outweighs aggressive selling. But unless new demand emerges, either from China or unexpected export pull, the market’s mood will likely remain heavy well into Q1.
What could turn things around?
- Weather or disease disruptions: Drought in Oceania or another bluetongue wave could tighten supply faster than expected.
- Currency movements: A weaker euro could give EU exporters much-needed price competitiveness. This will have the heaviest impact on SMP we feel
- Government intervention or stock programs: Not our base case, but worth watching if political pressure mounts.
For now, though, fundamentals rule — and they’re not kind to bulls.
Trading Strategy: Stay Liquid, Stay Light
In times like these, flexibility beats conviction. Buyers with coverage into early Q1 can afford to be patient; spot buyers might soon find value opportunities, especially in cheese and powders. Sellers, on the other hand, should stay realistic — waiting for a price floor that never comes can cost more than selling slightly below your comfort level.
The current environment rewards traders who:
- Hedge selectively, using forward coverage where liquidity still exists.
- Keep close contact with the physical market, as sentiment can turn before the data does.
As always: in dairy, the smartest traders aren’t the ones who predict perfectly — they’re the ones who adapt fastest.
Final Thought
We’ve looked at sentiment, stocks, and milk prices. All three tell the same story: the market has plenty of product, limited excitement, and few clear bullish triggers. But as we all know, dairy markets rarely stay quiet for long. Until then, enjoy Cologne, trade responsibly, and if you find yourself swapping business cards more than containers — that’s probably the most profitable deal of the week.
More from the desk
Our Long View Before Our Long Break 
Our Long View Before Our Long Break
Last week the market found a bit of stability. After lower trades on cheese, the cheese market traded slowly up, although a real rally remains absent. Butter prices did dip a bit further, although at the start of this week we see some strength on the back end of the curve. And on powder, our bullish feeling just doesn't go away — and now we can find some confirmation in the market as well.
Dairy Carry Has a Shelf Life 
Dairy Carry Has a Shelf Life
Last week was bearish across the board — every product we broker leaned the wrong way. Powders lost more momentum, cheese slipped well below €3,000 for some products, and butter continues to impress with just how much keeps showing up. Supply, supply, supply.
Summer Shopping or Summer Sale? 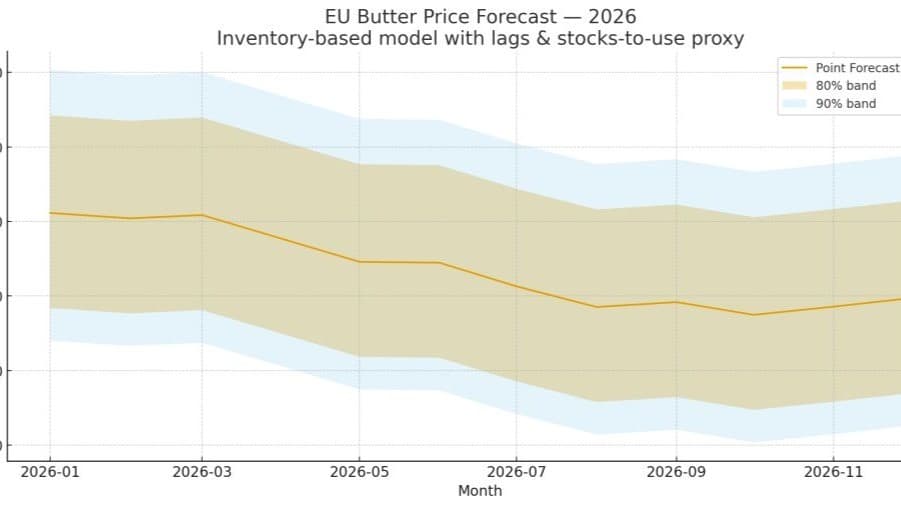
Summer Shopping or Summer Sale?
Last week was again a bit of a bearish week for the entire dairy industry. With cream prices under pressure and milk intake still strong, we keep seeing a market that has more supply than demand. Butter prices took another step lower, cheese prices cracked, and the powder market gave back a bit of its gains again.
The weekly report
Get it before it is anywhere else
Every market report, straight to your inbox the moment it is written. Butter, cheese, powder, liquids — pick what you actually trade.
Roughly weekly · Free · Unsubscribe any time