
Bullish Sentiment to Strengthen Bearish Fundament

Last week, the dairy market did not gently trend higher — it ran. Every product, every region, no exceptions. Positive Gulfood momentum, bullish US sentiment, reinforced by a firmly bullish GDT, set futures markets on fire. SGX, CME and EEX marched higher throughout the week, printing fresh recent highs and catching everyone off guard — buyers, traders, and even the most optimistic sellers who suddenly wished they had sold just a little less in recent weeks. From a technical perspective, explanations are plentiful; we have seen the analyst showing the higher low prints and the double test of price floors. And if you talk to traders long enough, you could watch a textbook case of panic buying and short covering unfold in real time. Finding a solid fundamental justification, however, proved far more challenging.
We spent the weekend doing what markets force you to do after a move like this: staring at screens, revisiting assumptions, and asking what we supposedly missed. Apart from a few overlooked details, our conclusion hasn’t changed. The market looks far more vulnerable to new lows than sustainably capable of new highs. Ironically, if this bullish sentiment manages to linger a bit longer, it may end up strengthening the case for lower prices — not higher ones.
Those who know us well know one thing: being structurally bullish is not in our DNA. We’re opportunistic by nature, but our default market stance tends to lean bearish. One long-term partner once described us as “bearish by nature.” We don't necessarily disagree. Yet even through bearish goggles, it’s impossible to ignore the price action of recent weeks.
What has stood out most is not the rally itself, but the behaviour around it. Seasoned traders — the kind who normally preach discipline — have been calling to confirm higher purchases, often while openly admitting they don’t believe in the move. Still, being caught short and not act on it in a market that rallies like this is simply poor risk management. Risk desks had little choice: shorts were closed, exposure was reduced, and protection came first. At the same time, producers were advised to do the exact opposite — step back, close the door, and let the phone ring.
As we discussed in last week’s report, Volatility On, Risk Off, the first visible outcome of risk-off strategies is not calm — it is volatility. Last week delivered a textbook example. Sales liquidity evaporated in the physical market, while futures markets worldwide thinned out dramatically, creating the conditions for a global short squeeze. With trading houses increasingly active across SGX, CME and EEX — often via inter-exchange spread strategies — pressure in one market quickly spilled into the others. Once one leg squeezed, the rest followed. While dairy futures have matured significantly over the past decade, liquidity remains far too shallow to absorb the kind of forced buying we witnessed. That fragility is what allowed the move to accelerate so violently.
On EEX, sellers stepped aside entirely, leaving buyers to chase limited volume at premiums of up to €600 for butter, € 350 on SMP and € 300 on cheese versus the prior weeks. Those with access to physical hedges briefly found relief: EU physical offers were still available at discounts of up to €500 for butter versus futures, often with week-long validity. By the end of the week, those offers vanished. New ones either failed to appear or re-emerged aligned with EEX levels.
This is where bulls really get something to smile about. Tight nearby availability for some commodities, disappearing sales liquidity, and forced risk reduction created a price environment where markets could only move one way. Add firm US sentiment, supportive GDT outcomes, and cross-market positioning, and the rally suddenly looks less accidental.
But — and this remains the uncomfortable part for the bulls — little has changed on the fundamental side to justify sustained highs. If anything, extended bullish sentiment may do more to slow demand and unlock supply than to support another leg higher. Although we cant say this week will not be bullish. Last week we saw big traders and some well-informed end users run to the market. This week, we might see the smaller ones do the same thing. And while they might not be looking for large volumes to cover, if many buyers seek a little, that still adds up to a lot of extra demand. That might be the moment for traders to rethink what just happened and, if the markets give another leg up, position themselves again a bit on the short side, but now on a significantly higher level.
In other words, the rally explains itself remarkably well. The sustainability of it still does not.
Fundament: This Rally Stretches the Bearish Fundament
But back to fundamentals, because that is the data we have been scraping over the last 48 hours. Trying to find data that explains a 15% price rally in butter or a 20% rally in SMP is not easy. Milk production data from the last weeks continues to show the UK, France and Germany well above last year's milk numbers, without a significant slowdown anywhere. Starting with the SMP market, below we take you through the data we are looking at. For those asking, we use StoneX Plus as our primary data source.
SMP: A Price Jump that makes sense
We are firm believers that stocks versus demand ratios are a strong indicator of where prices should trade. Of course, it is not a perfect tool, but when combined with milk supply forecasts and international demand, it provides a solid framework for valuation. Reported SMP stocks are roughly 40% higher year-on-year, based on data representative for November and December stocks forecasted even higher. At face value, 40% higher stocks — while both international and internal EU demand were far from exciting — justified sustained price pressure rather than a rally. And that is exactly what we saw in November and December. Price pressure based on stock pressure.
However, those lower prices triggered something that is not yet fully visible in official data, but is consistently observed by our partners across the market: exports have increased dramatically, removing large volumes from EU SMP stocks.

If we look at the stock forecast, we see a significant downward revision. In fact, the updated forecast brings EU SMP stocks back to last year’s levels — a period when EEX prices in February were trading around €2,500, with a forward curve pointing towards €2,750 in Q3 and higher onwards. One of the strengths of StoneX Plus is the ability to go back in time and analyse the exact same dataset as last year, including the forward curve visible at that point. This comparison is shown in the graph below.
This week’s short squeeze briefly pushed prices beyond those historical levels, but by Friday around 17:00, that momentum faded. The current forward curve now looks remarkably similar to where it stood a year ago.

What we like about the StoneX Plus stock forecast is that it accounts not only for expected production changes, but also for anticipated export growth. While every model comes with assumptions — and therefore errors — the directional trend has historically been reliable. Based on increasing EU production and the continued assumption that Europe remains competitive on the global market, stocks are expected to decline and realign with last year’s levels.
Unless EU production drops sharply — which appears unlikely given current milk prices — or protein demand accelerates significantly (where current consumer trends could offer some upside), we think that the current market level for SMP reflects the market quite wel. A correction back towards the low €2,000 levels for SMP seems unlikely. At the same time, the pace of the recent bull run is unlikely to be sustained, as part of the move was clearly driven by a short squeeze.
Our base case remains that prices could settle in the €2,400–€2,500 range for spot, consistent with historical stock levels. Buyers willing to go forward should expect to pay a higher risk premium, as the volatility seen over the past month justifies increased forward pricing risk.
Butter: A price Jump that doesn't make sense
We will be honest: we were surprised by both the bullish SMP and butter moves. Looking back at the data, it is clear we missed some key figures that deserved more attention, which explains the bullish SMP run. So what did we miss in our butter analysis?
*disclaimer* The challenge remains that any forward-looking view requires assumptions — assumptions that may prove wrong over time. That said, we believe the assumptions we make here are on the conservative side. Our starting point is that EU butter production in the three months prior and the three months ahead is higher than a year ago. This assumption is driven by persistently weak cream valorisation, making butter production the most attractive outlet for virtually every available churn.
Recent data supports this view. Weekly data about German butter production continues to show a year-on-year increase of roughly 15%, driven by approximately 6% higher milk collections. This confirms that supply, at least for now, remains firmly on the heavy side. The same strong feedback were are getting back from partner in France, Belgium and Poland.
Once again, we turn to stock levels — and we will share the same stock-forward graph we have referenced before. It was this very stock-forward curve, two years ago, that gave us our first indication that butter prices could climb towards €8,000, as StoneX Plus was among the first to capture the effects of declining production and rapidly falling EU stocks.
The reason we prefer a 20-year perspective is simple. While stocks fell to their lowest point in two decades during 2024, the projected peak in June 2026 is shaping up to be the highest stock level Europe has seen in the past 20 years.

The last time the EU carried a comparable level of butter stocks was in February 2020, when butter prices were quoted around €3,600 — strikingly close to the levels reached two weeks ago. Based purely on stocks-to-price ratios, that comparison made sense. But this is where we stop comparing years. In 2020, COVID broke historical relationships. Prices initially collapsed, only to surge a year later on the back of unprecedented government stimulus and liquidity. The next two years datapoint are diverting a lot if you zoom out.

A more meaningful comparison is to examine EEX butter prices versus stock levels over a longer time horizon. Using StoneX Plus, we combined Dutch butter quotations and stock data into a single chart. The result shows a clear and persistent correlation between stocks and prices over time.
The pattern is consistent: the lowest prices — or highest price pressure — tend to occur when stocks peak around Q2, while Q1 generally offers more support. Conversely, the highest prices are only sustained when stocks are genuinely scarce. StoneX Plus does not produce a forecast based on this graph, but when we apply our AI tools — factoring in the past five years of inflation — the outcome consistently points to butter prices between €2,800 and €3,300 in Q2.

Looking ahead inevitably requires assumptions. In this case, the analysis relies on continued higher production — a scenario supported by current milk prices. Importantly, the stock forecast already incorporates higher export volumes (the EU should get competative) and a slowdown in production later in the year. But both assumptions would be difficult to justify if prices were to remain elevated on last week levels for an extended period.
When we combine this data with the feedback we received last week — from even the most optimistic bulls and some of the best-informed analysts (“WTF just happened?”) — and place it alongside fundamentally bearish indicators, it becomes difficult to interpret last week’s rally as anything other than a classic short squeeze.
The demand side continues to structurally shift from fat to protein — a trend visible in consumption data for some time. Stronger SMP demand, which we view as structurally more logical, requires more skimmed milk and inevitably produces more cream. In other words: supply pressure in butter remains intact.
That said, we are far from convinced the rally is already over. Nervous buyers for Q3 and Q4 could keep prices elevated in the near term. But structurally, elevated prices dampen demand, make much-needed exports increasingly difficult, and ultimately reinforce the bearish scenario the EU butter market appears to be heading towards.
What would prove us wrong?
Markets have a habit of humbling conviction, so it is only fair to outline what would invalidate our current view.
First, a material slowdown in EU butter production. Our base case assumes that current milk prices and weak cream valorisation continue to incentivise butter output. If production fails to materialise — whether due to unexpected milk supply disruptions, processing constraints, or a sharp shift in cream economics — the anticipated stock rebuild would be delayed or cancelled altogether.
Second, export demand absorbing stocks faster than forecast, even at elevated price levels. Our analysis assumes that higher prices eventually restrict EU competitiveness on the global market. If export flows remain robust despite current price levels, the stock overhang may never fully develop in its full form. Still higher exports cant resolve the EU's fat problem.
Third, a structural acceleration in fat demand, rather than the protein-driven demand we currently observe. While consumption trends continue to favour protein, a sustained recovery in butter demand — beyond seasonal effects — would challenge the assumption that supply pressure remains dominant. If Kim Kardashian tomorrow starts rubbing on butter instead of sunscreen, € 10.000,- butter is back on the radar.
Finally, persistent risk aversion among buyers. If end-users continue to prioritise coverage over price discipline well into Q3 and Q4, sentiment-driven buying could continue to support prices longer than fundamentals alone would justify.
Any combination of the above would force us to reassess both the timing and the magnitude of the expected correction.
Cross-commodity conclusion: fat versus protein
When stepping back from individual price moves, the broader picture across dairy commodities becomes clearer.
Demand is structurally shifting towards protein, not fat. Some claim a strong correlation with Ozempic medication, something we tend to lean towards as well. This supports SMP and explains why lower prices earlier this year were able to unlock meaningful export demand. From a fundamental perspective, this is logical and sustainable.
However, stronger protein demand does not occur in isolation. It requires more skimmed milk — and in doing so, it inevitably produces more cream. In the US our partners expect the increase of cheese production to increase WHEY proteins and cheese, and reduce the smp/butter output. In a market where fat demand is not expanding at the same pace, this creates a structural imbalance: protein tightens while fat remains under pressure.
This dynamic explains the current divergence. SMP finds fundamental support as stocks move and demand improves. Butter, by contrast, remains heavily exposed to supply-side pressure, even as short-term sentiment and positioning temporarily distort prices.
Final note
Last week’s rally reminded us how quickly markets can move when positioning, liquidity and sentiment collide. Prices adjusted faster than data could follow, and in that environment, conviction takes a back seat to risk management.
Looking through the noise, the picture becomes clearer. Fundamentals have improved enough to explain why prices moved higher, but not enough to remove downside risk. Protein demand is doing the heavy lifting, butter supply remains abundant, and stocks — while no longer static — are far from tight.
That leaves us with a market that is nervous, volatile and highly reactive. One where prices can remain elevated longer than fundamentals justify, yet remain vulnerable once sentiment cools and liquidity returns.
In short: last week was about positioning. The coming weeks will be about balance.
More from the desk
Our Long View Before Our Long Break 
Our Long View Before Our Long Break
Last week the market found a bit of stability. After lower trades on cheese, the cheese market traded slowly up, although a real rally remains absent. Butter prices did dip a bit further, although at the start of this week we see some strength on the back end of the curve. And on powder, our bullish feeling just doesn't go away — and now we can find some confirmation in the market as well.
Dairy Carry Has a Shelf Life 
Dairy Carry Has a Shelf Life
Last week was bearish across the board — every product we broker leaned the wrong way. Powders lost more momentum, cheese slipped well below €3,000 for some products, and butter continues to impress with just how much keeps showing up. Supply, supply, supply.
Summer Shopping or Summer Sale? 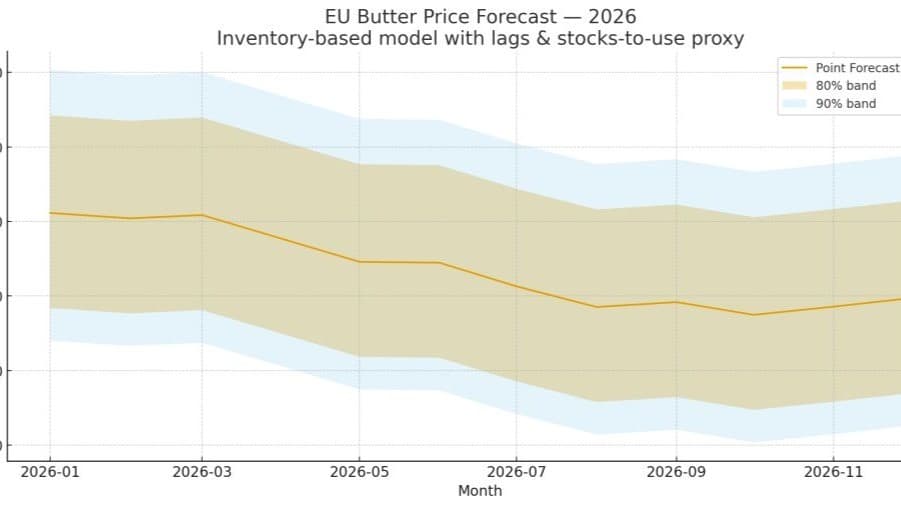
Summer Shopping or Summer Sale?
Last week was again a bit of a bearish week for the entire dairy industry. With cream prices under pressure and milk intake still strong, we keep seeing a market that has more supply than demand. Butter prices took another step lower, cheese prices cracked, and the powder market gave back a bit of its gains again.
The weekly report
Get it before it is anywhere else
Every market report, straight to your inbox the moment it is written. Butter, cheese, powder, liquids — pick what you actually trade.
Roughly weekly · Free · Unsubscribe any time